Conduit Docs
  • Getting Started
    • Importing Data
    • Connecting Multiple Accounts
    • How To Invite Additional Team Members to Your Account
    • How Does the Trial Work?
    • What's a Table/Data Schema?
    • Number of Sub-Connections
    • Default Time Range for Downloading Data
    • Conduit Data Lake
    • Conduit vs Boost.Space
    • Conduit vs Reportz.io
    • Conduit vs Google Looker Studio
  • Use Cases
    • Use Case: AI-powered Text Extraction
    • Use Case: Track Ad Campaign Performance with Conduit
    • Use Case: Enhancing Project Management with Copilot
    • Use Case: Using Conduit for Financial Analysis
    • Use Case: Use ChatGPT with your data
    • Use Case: Build financial models from raw transactional data and generate P&L statements.
    • Use Case: Marketing data analytics
    • Use Case: Using data science frameworks using your data in spreadsheets Low-Code
    • Use Case: Custom Dimensions for Ad Operations
    • Use Case: Custom dimensions for E-Commerce
    • Use Case: Extract invoices from PDF
    • Use Case: Export data from SaaS applications to your spreadsheet
    • Use Case: Online store and a physical retail locations consolidated
    • Use Case: Pull data from Advertisement platforms to a spreadsheet
    • Use Case: Consolidation of data received as separate files, for example, separate Excel reports
    • Use Case: Names, IDs, SKUs normalization
    • Use Case: Integrating Conduit with a custom CRM using SSO/OAuth2
    • Use Case: Chat Bot for Your Data
    • Use Case: Display Net sales On a Dashboard by Subtracting Ad spend from Total Sales
    • Use Case: Conduit for Healthcare Applications
  • Security & Data Privacy
    • Data Retention Policy
    • How Conduit Complies with GDPR?
    • Security
  • Spreadsheets
    • Writing data to spreadsheets: Overwrite and Update
    • Using Formulas in Spreadsheets
    • The Time Range in formulas
    • The table in the spreadsheet does not start from the first line
  • Conduit for Digital Agencies
    • How to Use White Label
    • What is a Workspace and a Sub-account
    • Use Case: Creating a Dashboard for Two Clients
    • Users in Your Team vs. Sub-Accounts in Workspaces
    • Deleting a Workspace
    • How to Log Into a Workspace
    • How to Buy Additional Workspaces
    • Schedulers in Workspaces
  • Troubleshooting
    • Error codes and how to troubleshoot data-related issues
    • Google Drive Refusing To Connect
    • Why Are my Shopify stats different?
    • Facebook Integration: How to Fix the GraphMethodException Error
  • Copilot
    • Copilot Roles: Data Analyst vs AI Generalist
    • Conduit Copilot vs. ChatGPT – What's The Difference?
    • How to Tune the Copilot
    • Data Sources for Copilot
  • For Developers
    • IP Addresses of Conduit Servers
    • Create an AI Сopilot for your app
    • Manage your AI Copilot users
    • Upload CSV files to Conduit via API (Guide)
  • Integrations
    • Instagram Integration
    • Dashboard Widgets Based On a SQL Connection
    • GA4 Integration Notes
    • Salesloft Integration
    • Self-service and Manual integrations
    • Installing Google Sheets Add-On
    • Slack Integration
    • YouTube Integration
    • HubSpot Integration
    • Conduit integration for Bigcommerce
    • Xero Integration
    • Recharge integration
    • Wrike Integration
    • Zoho Integration
    • Monday.com Integration
    • ActiveCampaign Integration
    • ClickUp Integration
    • FreshSales Integration
    • Google Ads Quality Score
    • Facebook Ads Reach
    • Shopify Net Sales and Returns
    • Gorgias tickets with Spam/Deleted/Auto-Close statuses
    • Looker Studio Connector
  • Workflows
    • Workflows – Adding New Columns
    • Workflows – using the Join by Key block
    • Workflows – using the Union block
    • Workflows – using the Transpose block
    • Workflows – creating a weekly Ad Spend report
Powered by GitBook
On this page
  • Report
  • Demo: How the Report formula is used
  • Using Multiple Formulas within the Same Spreadsheet
  • How to Fix Errors in Formulas
Edit on GitHub
  1. Spreadsheets

Using Formulas in Spreadsheets

PreviousWriting data to spreadsheets: Overwrite and UpdateNextThe Time Range in formulas

Last updated 11 months ago

Conduit offers two ways to transfer data to spreadsheets:

Building block “Save dataset to Google Sheets”

  • Formulas

  • In this article, I will talk about using formulas.

Conduit supports two formulas to be used in Google Sheets.

  • REPORT - Place a table to a spreadsheet

  • METRIC - Place a single metric to a spreadsheet

Report

The Report formula copies a table from Conduit into a spreadsheet. It has four parameters:

  • report

  • start_date

  • days

  • row_count

report- data source name

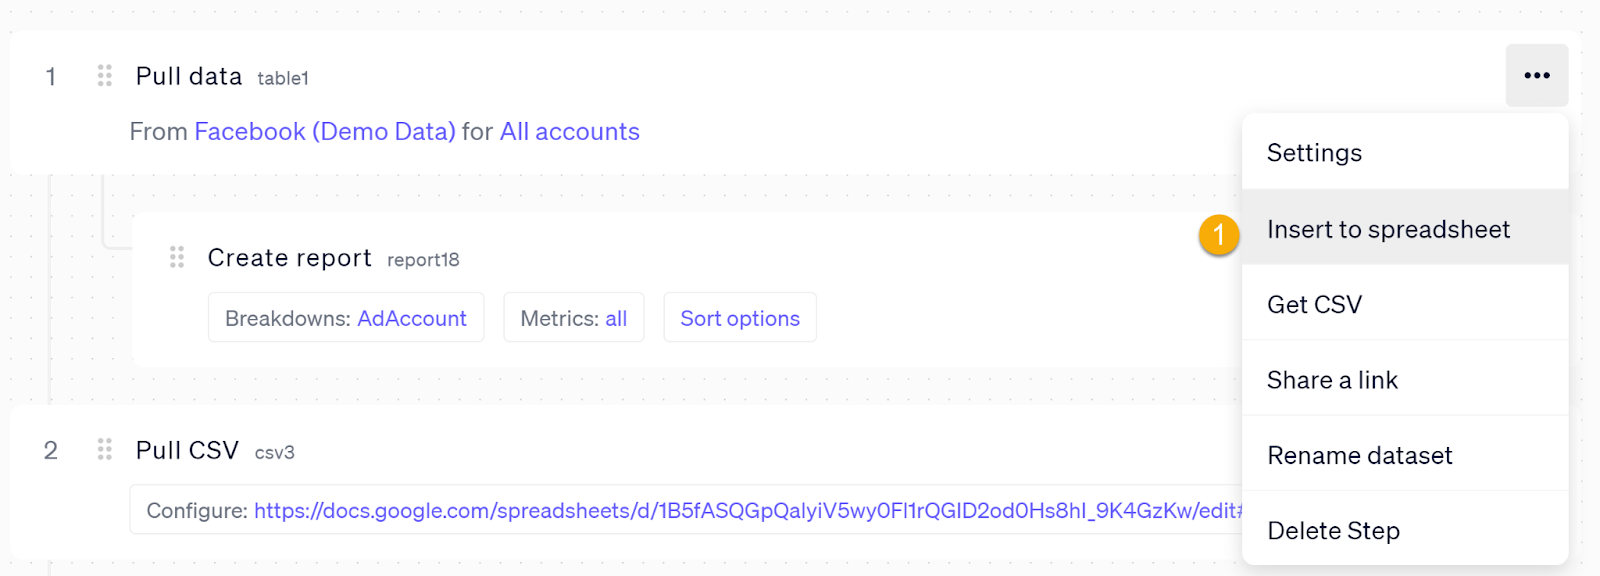
The name of a data source is the first parameter of the formula. The source of data can be any building block in the workflow. The screenshot below shows 4 data sources:

  • table1 - Raw data from Facebook

  • report8 - Data from Facebook aggregated by Ad Account

  • csv3 - Raw data from a spreadsheet

  • union4 - The result of merging rows from table1 and rows from csv3

The formula can use any data source from any workflow.

Date range

The Report formula always retrieves data for a range of dates. This range can be selected in two ways:

  • Explicitly in the formula, e.g. =report(“table1”, "2022-05-01", 7)

  • Implicitly: the time range selected in the workflow is used

We recommend using explicit date ranges. To select dates, you can use cell references, e.g. =report(“table1”,B1,C1)

More information you can find here.

Using Formula Builder

Conduit has an auxiliary UI that helps to build a formula.
In this window, the user can choose parameters for the formula, copy and paste the formula to a cell in the spreadsheet.

Spreadsheet updates

After the user inserts the formula for the first time, Google Sheets stores the response from Conduit server for a few days. Changes to data in Conduit don’t automatically change data in the spreadsheet. This is a known limitation of Google Sheets.

For example, you changed the dimensions set in the construction block Create Report. It doesn’t mean that the spreadsheet will be automatically updated.

To update the spreadsheet, you have to change the formula and press Enter.

When Google Sheets sees a new formula, it re-queries data from Conduit. E.g. you can select the name of another report and then get the previous name back.

Demo: How the Report formula is used

Let’s have a look at the example. Our objective is to create a new Workflow

  1. Drag and drop a new Pull Data block.

  2. Select Facebook (Demo) as a data source. This data source should be connected first.

  3. Rename the block as ‘table1’.

  1. Create a new spreadsheet

  2. Connect Conduit's Google Add-On to the spreadsheet. To do this, click Launch, just once.

In a second, the heading, column names, and data will appear in the spreadsheet. Total rows shows how many data rows there are in table1 report. Rows shows how many rows are now downloaded to the spreadsheet.

You can turn the header off. To turn it off, go to Settings and deselect the checkboxes.

Using Multiple Formulas within the Same Spreadsheet

Let’s create the second block with the name ‘table2’.

Enter =report(“table2”) in cell A14 and hit Enter.

Now, the spreadsheet contains two tables.

How to Fix Errors in Formulas

Error: Dataset with name {} not found.

In this case, please check the dataset name in the formula

Error: Array result was not expanded because it would overwrite data in {}.

This message warns that the dataset is bigger than free space in the spreadsheet.

Let’s look at the screenshot below.

The formula says that it wants to take 100 rows from the dataset, but there is another formula in Row 14. This is why the maximum number of rows for the formula is 12 (10 data rows and 2 heading rows).

Metric The Metric formula copies a cell from Conduit to a sheet. It has four parameters:

  • report

  • metric

  • start_date

  • days Report is the source of data. This parameter is similar to the Report formula. Metric is the name of a column in the data source. You can look through all possible names in three ways: 1. Click Metrics

  1. Export data from the data source and open the CSV file in Excel or Numbers.

  1. Also, you can open Formula Builder and the list of formulas: