GA4 Integration Notes
Conduit offers two types of integrations with Google Analytics 4
GA4 Predefined for E-commerce
GA4 Custom
We provide multiple versions due to significant limitations in the GA4 API, which restricts reports to a maximum of nine dimensions and metrics each.
GA4 Predefined for E-commerce
This GA4 integration includes the following set of dimensions and metrics
Account
Add to Carts
Campaign ID
Bounce Rate
Campaign Name
Checkouts
Country
Conversions
Date
E-commerce Purchases
Device
Engagement Rate
Medium
Publisher Ad Clicks
Operating System
Publisher Ad Impressions
Property
Publisher Revenue
Source
Revenue
Term
Sessions
Transaction ID
---
However, if you require different data points, you should opt for the GA4 Custom integration.
GA4 Custom
When you connect GA4 Custom, the UI features a search bar, allowing you to select any dimensions and metrics you need, with the limitation of no more than nine per report.
We also suggest naming the integration to clearly indicate which dimensions are included in the report. Additionally, you can connect multiple integrations, each tailored with its own unique set of dimensions and metrics.
GA4 has a drawback where the names of dimensions and metrics aren't displayed in the user interface. As a result, within the Imports interface, you'll encounter generic labels like "Dimension 1", "Dimension 2", and so forth. Additionally, if you do not utilize all 10 dimensions, you'll notice empty columns for the unused dimensions. However, this does not impact the quality of the data.
We plan to address these issues in upcoming versions. In the meantime, there's a workaround: when using Workflows, you can rename columns through the Report building block.
Please be aware that certain fields may be accessible in the GA4 UI but not available through the API. If you encounter any such fields, kindly notify us by sending a note.
If you see a No data message for a generated report, this may mean that you are trying to use demographic data. Please see an article on how to enable demographic data in GA4.
Gender and Age
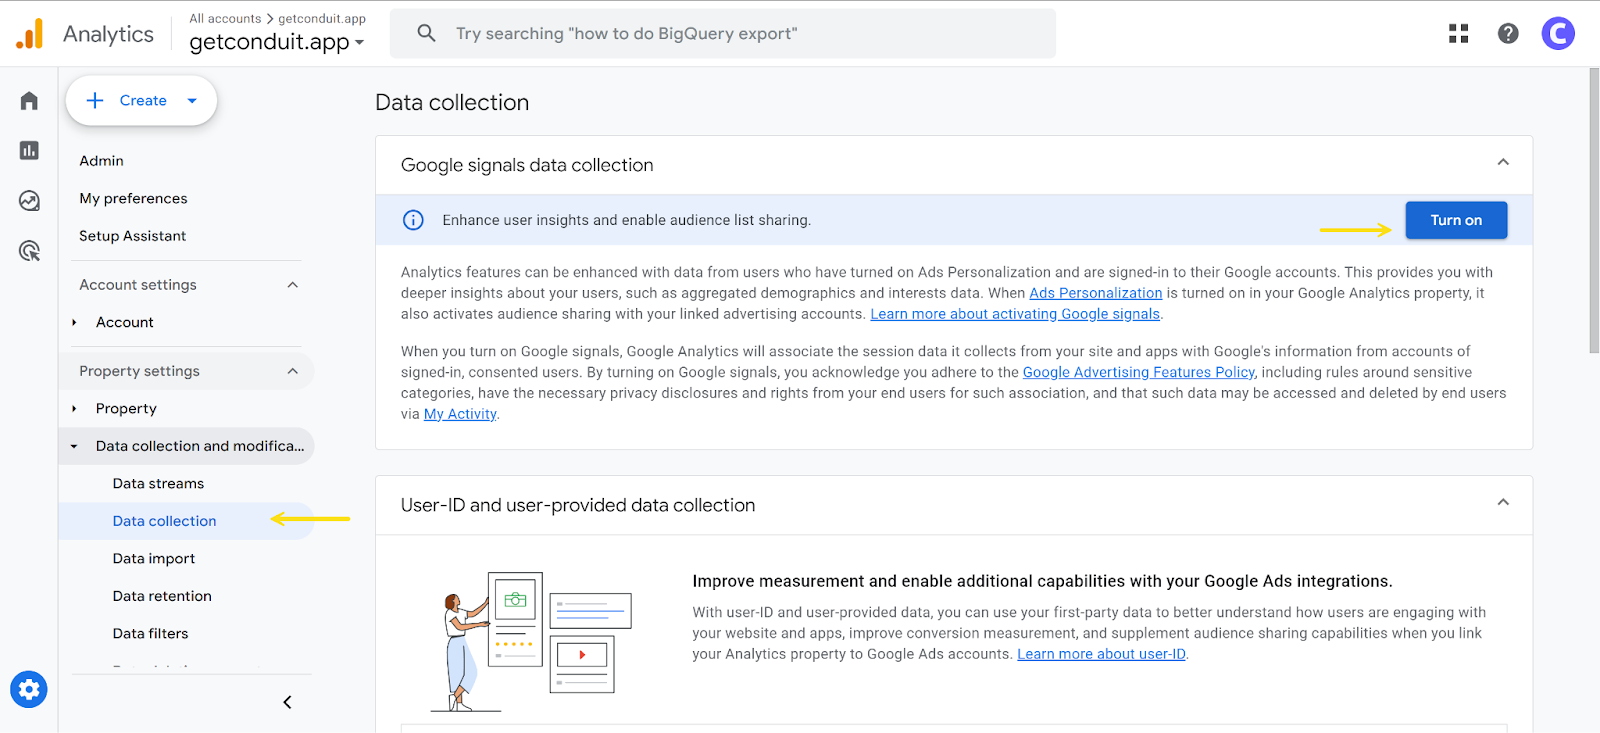
GA4 doesn’t show demographic data by default. In order to enable it, you should activate another feature in GA4 that’s responsible for it. This feature is called Google Signals.
Navigate to Admin -> Data settings -> Data collection Enable (1) “Google Signals data collection” and (2)“Granular location and device data collection”
https://support.google.com/analytics/answer/9445345

Days with missing demographic data
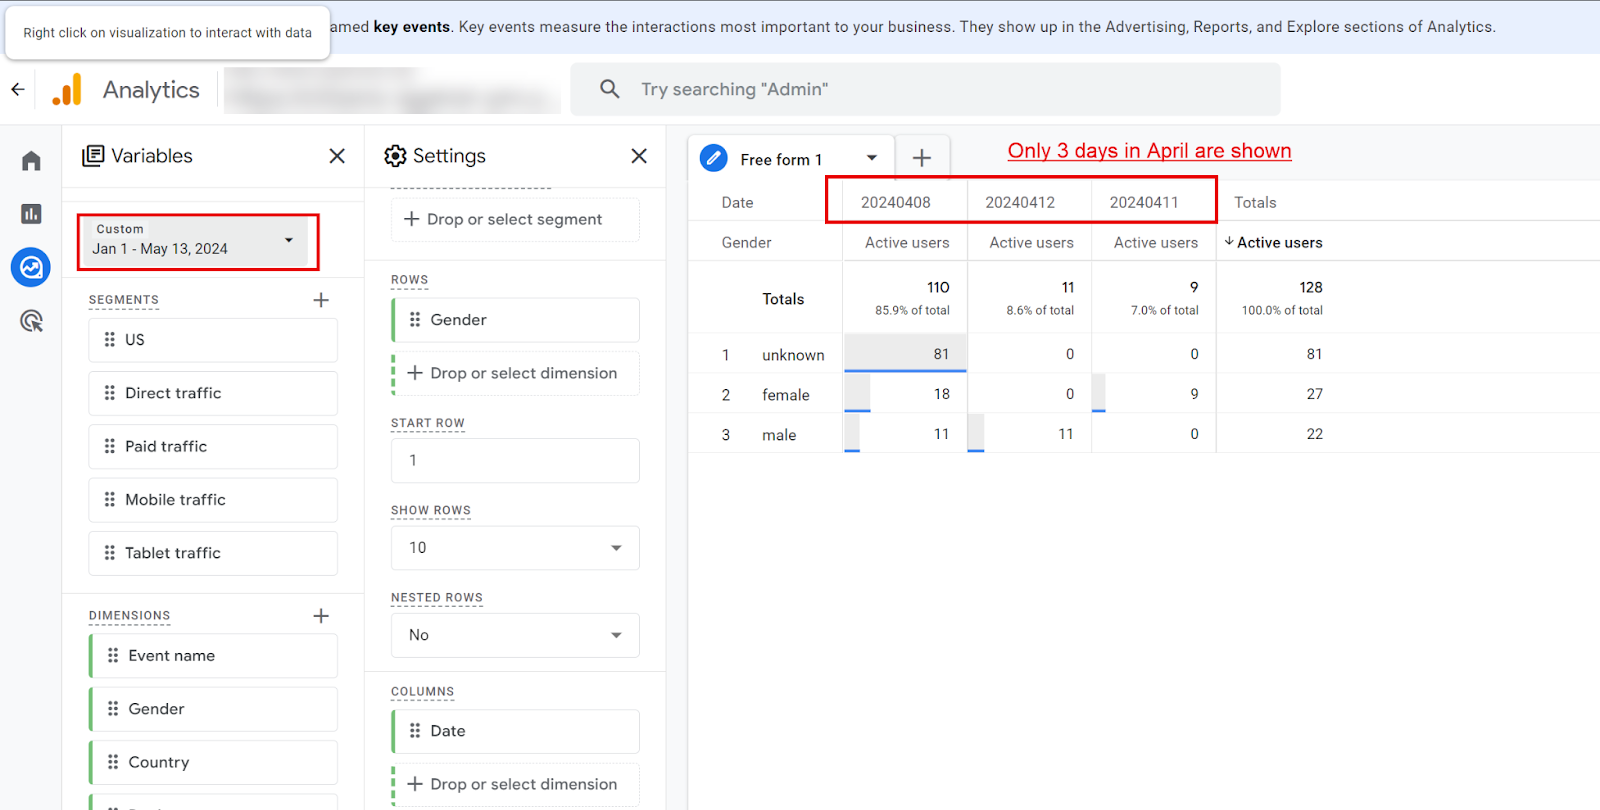
Some days with statistics that include demographic data may be missing due to the data threshold.
Data threshold is a mechanism in Google Analytics that applies system-defined limits to reports and explorations to protect individual users' identities and sensitive information, impacting data access in reports with specific demographics, interests, or other detailed signals.
When the data in a report or exploration is limited due to data thresholds, the data quality indicator at the top of the report includes the message, "Google Analytics has applied thresholding to one or more cards in this report and will only display the data in the cards when the data meets the minimum aggregation thresholds."

Please note that GA4 only displays total statistics, not those broken down by gender.
When attempting to create a report by day, GA4 disregards the selected period and only shows days where the threshold would have been exceeded.

When Data thresholds are applied
Demographics data Data may be withheld when viewing a report or exploration or making an API call that includes demographic data or audiences defined using demographic data.
Google signals Data may be withheld when Google signals is enabled and either the blended or observed reporting identity is used, and you have a low user count in the specified date range. When Google signals has been enabled, reports with low user counts may continue to be subject to thresholding for a period of time after Google signals is disabled. If the device-based reporting identity is used, you should not see data thresholding.
Search query information If a report or exploration includes search query information, the row containing that data may be withheld if there aren’t enough total users.
Last updated